Products

 Home > Design Technical > Design Data


Allowable design stress for PE Pressure Pipes

If PE pipes are used to convey fluids of excessive temperature then the allowable design stress or the pressure-class ratings should be appropriately reduced in accordance with following graph.

Allowable design stress for uPVC Pressure Pipes

If uPVC pipe or uPVC valve is used to convey fluids of excessive temperature then the allowable design stress or the pressure class ratings should be appropriately reduced in accordance with following graph.


Potential Evapo transpiration Rate (PET) for different Climate

Climate Temperature (ºC) Humidity (%) PET (mm per day)
Cool Humid Less than 18 50 - 85 2.54 - 3.80
Cool Dry 18 - 25 Less than 50 3.80 - 5.00
Moderate 28 - 36 50 - 65 5.00 - 6.35
Hot Humid 36 - 40 50 - 85 6.35 - 8.90
Hot Dry 40 - 45 Less than 50 8.90 - 10.00
Hot Dry Desert 45 - 50 Less than 30 10.00 - 11.50

Recommended Sprinkler Spacing

Wind velocity
miles / hr.
Maximum spacing
Square spacing Triangular spacing
0 to 3 55 % of diameter 60 % of diameter
3 to 6 50 % of diameter 55 % of diameter
6 to 12 45 % of diameter 50 % of diameter

Maximum Precipitation Rate (mm per hour) of Sprinkler in different Soil and Ground Slope

Soil Type 0 to 5% 5 to 8% 8 to 12% 12 to 20% Above 20%
Coarse Sandy Soil 50 50 40 40 38
Coarse Sandy Soil over compact sub soil 45 45 30 30 30
Light Sandy Loam 40 40 25 25 25
Light Sandy loam over compact sub soil 30 30 20 20 20
Uniform Silt Loam 25 25 15 15 15
Silt Loam over compact sub soil 15 15 10 10 10
Heavy Clay/ Clay Loam 5 5 3 3 3


Calculating Precipitation Rates

Depending upon the construction of the irrigation system, the precipitation rate may be calculated by either a sprinkler spacing or a total area method.

Sprinkler Spacing Method

The precipitation rate should be calculated for each individual zone. If all sprinkler head on the zone have the same spacing, flow rate and arc of coverage.

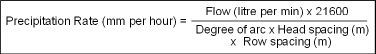
i. Any Arc and Any Spacing

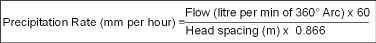
ii. Equilateral Triangular Spacing
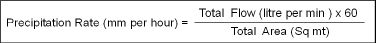
Total Area Method

The precipitation rate for a system is the average precipitation rate of all sprinklers in an area, regardless of the spacing, flow rate or arc for each head. The total area method calculated all the flows of all heads in any given area.

Matched Precipitation Rates

A zone or system in which all the heads have similar precipitation rates is said to have matched precipitation rates. Systems that have matched precipitation rates reduce wet and dry spots and excessive run times which lead to high water consumption and increased costs. Knowing that the sprinkler spacing, flow rates and arcs of coverage after precipitation rates, a general rule of thumb is : as the spray arc doubles, so should flow.

......90º Arc (Quarter Circle) - (0.23 m3/hr, 3.81 litre/min)

…….. 180º Arc (Half Circle) - (0.45 m3/hr, 7.62 litre/min)

……...360º Arc (Full Circle) - (0.91 m3/hr, 15.24 litre/min)

The flow rate of half circle heads must be two times the flow rate of the quarter circle heads and the full circle heads must have two times the flow rate of the half circle heads.

In the illustration, the same amount of water is applied to each quarter circle area and precipitation is therefore matched.

Types of Sprinklers based on Precipitation

Type of Sprinkler Precipitation Rate (mm per hour)
Low Volume Sprinkler Less than 13
Medium Volume Sprinkler 13 - 25
Big Volume Sprinkler Above 25

Solvent Cement Requirement for uPVC Pipes

Pipe Size
mm
No. of Joints*
per Litre
Pipe Size
mm
No. of Joints *
per Liter
20 330 125 45
25 270 140 36
32 225 160 27
40 180 180 20
50 135 200 15
63 125 225 12
75 103 250 9
90 79 280 6
110 54 315 5

Frictional Head Losses in Valves and Fittings (As equivalent to the length of pipe in meter)


Nominal
mm
45º
Elbow
90º
Elbow
Tee in Flow Side Out Let
Tee
Gate Valve Sprinkler Angle Valve Angle Valve Globe Valve
20 0.30 0.60 0.30 1.21 0.12 0.60 2.74 5.18
25 0.30 0.91 0.60 1.52 0.15 0.91 3.65 6.70
32 0.60 0.91 0.60 1.83 0.18 1.21 4.57 8.22
40 0.60 1.21 0.91 2.44 0.24 1.52 5.48 11.58
50 0.60 1.52 0.91 3.05 0.30 1.83 6.70 13.71
63 0.91 1.83 1.21 3.65 0.36 2.14 8.53 17.76
75 0.91 2.14 1.52 4.26 0.42 2.75 10.66 21.33
90 1.21 2.44 1.83 5.48 0.55 3.35 13.71 27.43
110 1.52 3.31 2.14 7.01 0.70 4.57 18.28 36.57
140 2.00 4.26 2.90 8.50 0.85 5.33 22.09 44.19
160 2.44 5.18 3.65 10.00 1.00 6.10 25.90 51.81


Related Pages:

Friction Loss in Jain Tough Hose 12mm OD (9.8 mm ID)

Friction Loss in Jain Tough Hose 16mm OD (13.4 mm ID)

Friction Loss in Jain Tough Hose 20mm OD (17.2 mm ID)

Friction Loss in J-Turbo Line® 12mm OD (10.6 mm ID)

Friction Loss in J-Turbo Line® 16mm OD (14.2 mm ID)

Friction Loss in J-Turbo Line® 20mm OD (17.2 mm ID)

Flow Nomogram for Polyethylene Pipes

Flow Diagram for PVC Pressure Pipes & Quick Fix™ Pipes


Small Ideas, Big Revolutions.